

You built an app. You deployed it. Done, right? Not really.
What happens when something breaks at 3 AM? What if users are getting errors and you have no idea why? What if the app is slow and you don’t know which part is causing it?
This is why monitoring is just as important as building the app itself.
What is Monitoring?
Monitoring means keeping an eye on your application while it’s running. You want to know if everything is working fine? Is something going wrong? Where exactly is the problem?
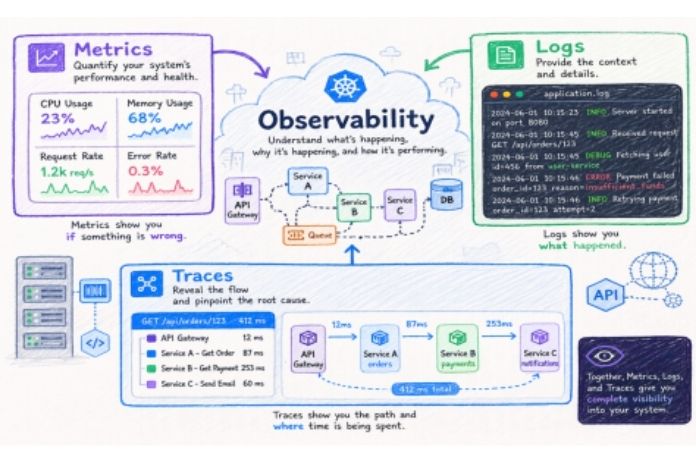
This falls under a bigger concept called observability. Observability has three parts:
Metrics gives the numbers that show your system’s health. Like how much CPU is being used, how many requests are coming in, how many errors are happening.
Logs give text records of what happened inside your app. Like When it happened(Timestamp), How serious it is(level), What actually happened (Message)
Traces gives the path a single request takes through your system. It shows you every step the request took, which service handled it, and how long each step took.
Why is Monitoring Hard Today?
Old apps were simple. One server, one app, one log file. But today’s apps are very different. They are made up of many small microservices talking to each other . They run on the cloud. They run inside containers like Docker and Kubernetes.
So when something breaks, it’s not obvious where the problem is. Is it Service A? Service B? The database? The cloud network?
Without proper monitoring, you’re just guessing.
Many Monitoring Tools Exists
Different tools exist for different jobs. Prometheus is good for metrics. ELK Stack is good for logs. Splunk handles enterprise logging. SolarWinds focuses on networks.
The problem? You need all of them together. That means multiple dashboards, multiple alerts, multiple tools to learn. Very messy when you’re trying to fix something urgently.
Datadog Changes the Game
Datadog is a single platform that does everything from collecting metrics, logs, traces, configuring alerts and dashboards, all in one place. Instead of jumping between different tools, you open Datadog and see everything.
How Datadog Works
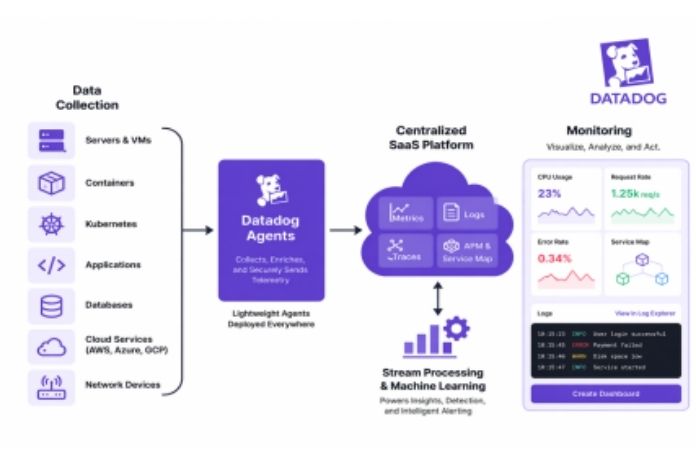
At a high level, Datadog works by collecting data from your systems and showing it to you in one place.
You install a lightweight Datadog Agent on the system you want to monitor, whether it’s a server, VM, cloud instance, or container. The agent runs in the background and continuously collects metrics like CPU, memory, disk, and network usage, along with logs from applications and traces for request flow across services.
It doesn’t collect data randomly. It pulls structured data from the OS, services, and integrations like NGINX, Redis, PostgreSQL, Docker, or Kubernetes. Once configured, it automatically knows what data to collect from each.
The agent then securely sends this data to the Datadog cloud platform, where it is processed, stored, and connected for easy analysis.
In the Datadog UI, you can view dashboards, set alerts, analyze logs, and trace requests. Everything is linked, so you can move from a high level issue to the exact root cause in one place instead of switching between multiple tools.
What Can You Monitor with Datadog?
Infrastructure: Is your server running fine? How much memory is being used? Are your containers healthy?
Application Performance (APM): Is your app responding fast? Which service is slow? Where is the delay happening?
Logs: What exactly happened when the error occurred? Search and filter through logs easily.
Synthetic Monitoring: Datadog pretends to be a user and visits your website automatically. It tells you if something is broken before real users notice.
Real User Monitoring (RUM): See the experience from an actual user’s perspective. How long did the page take to load? Did they see any errors?
Security: Is anyone trying to attack your system? Are there unusual patterns in your traffic?
Alerts and Notifications
Monitoring is only useful if someone gets notified when things go wrong. Datadog handles this too. You set up rules like “If CPU goes above 90% for 5 minutes, send me an alert.” When that condition is met, Datadog sends a notification to Slack, email, teams, or wherever your team is.
From the alert, you can jump directly to the related dashboard, logs, and traces. No searching around. Everything is connected.
Datadog can also learn what “normal” looks like for your system and alert you when something unusual happens even if it hasn’t crossed a fixed limit.
Why Datadog and Not Something Else?
Because everything is connected.
When you use separate tools, you collect data in different places and switching between them during an incident wastes precious time.
With Datadog, the flow looks like this:
You see a spike in response time → you click into the trace → you find which service is slow → you check the logs for that service → you find the error → you fix it.
All of that in one place. No tab switching. No guessing.
Building an app is step one. Keeping it healthy is step two and it never stops.
Leave a Reply